Undergraduate Degree Winners
Brandon Boldt
Front Range Community College
CGC Grower Climate & Wildfire Risk Assessment
This interactive Story Map presents a composite climate and wildfire risk assessment for 19 Colorado Grain Chain (CGC) member farms across three future time periods (2010–2039, 2040–2069, 2070–2099) under a moderate emissions scenario (RCP 4.5). Downscaled climate projections from the MACA v2 dataset were combined with USFS Wildfire Hazard Potential data to produce composite risk surfaces through weighted overlay and fuzzy gamma overlay methods in ArcGIS Pro. Farm-level risk scores were derived from zonal statistics within 5km buffers. Interactive visualizations — including a Leaflet raster map, Chart.js risk progression and component decomposition charts, and an ArcGIS Experience Builder — enable spatial and temporal exploration of results. Findings indicate all 19 farms reach High risk by late century, with Front Range farms diverging earliest due to elevated temperature and precipitation departure signals. No farms reach Very High risk under RCP 4.5. Interactive visualizations were developed with AI coding assistance (Anthropic Claude) and iteratively refined by the author. All GIS analysis, data processing, methodology, and narrative content are original student work.
References: MACA v2 — Abatzoglou & Brown (2012); USFS WHP — Scott et al. (2024), doi:10.2737/RDS-2020-0016-2; Colorado Grain Chain (coloradograinchain.com); US Census TIGER/Line 2023.
Harlan Ulmer
Colorado State University
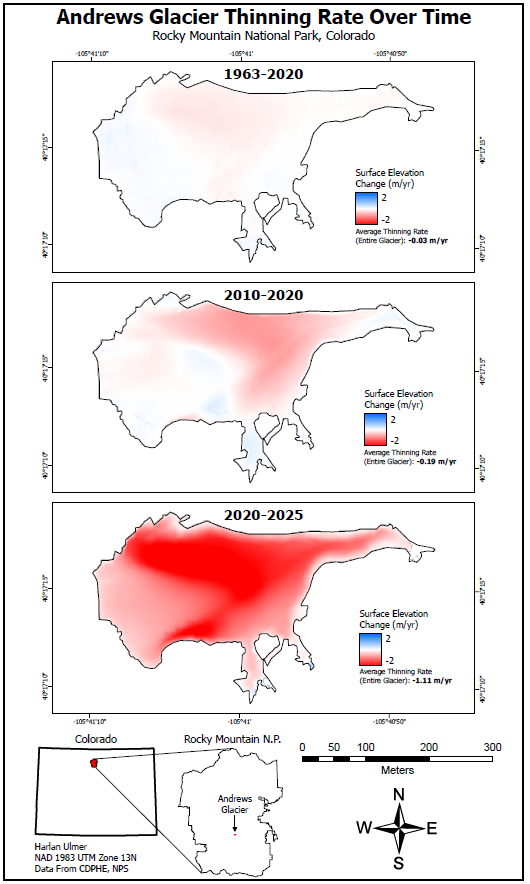
This map depicts surface elevation change rates, in meters per year, on Andrews Glacier across several time intervals. Andrews Glacier is located in Rocky Mountain National Park and is one of the last true glaciers in Colorado. This data was obtained through an undergraduate research project with glaciologist Dr. Dan Mcgrath at Colorado State University. Harlan has been working on the project since January of 2026, with the aim of assessing glacier volume changes by using novel remote sensing technologies. Glacier area change is the most convenient and commonly used way to track glacial melt, but Colorado’s glaciers are so small that their area change over time is barely noticeable. This is especially true for Andrews Glacier, whose area has been almost unchanged despite significant changes in volume.
As such, glacier volume changes are a more objective metric by which to measure glacial melt. To assess glacier volume changes over several historical intervals, sophisticated photogrammetry process called Structure from Motion which allows users to generate 3D point clouds from sets of digital images taken at different positions around a feature. Aerial imagery of the glacier were analyzed from 1963, 2010, 2020, and 2025. The result was shocking: Andrews Glacier experienced a massive acceleration in thinning over the past 5 years, with some areas of the glacier thinning by more than 2 meters annually. We suspect that the higher rate of thinning in the 2020s may be due to increased summer temperatures, as winter snow accumulations have been found to be relatively consistent over time due to wind-blown snow redistribution and avalanching.
Colorado state boundary obtained through CDPHE Open Data: https://data-cdphe.opendata.arcgis.com/datasets/colorado-state-boundary/about Rocky Mountain National Park boundary obtained through NPS Open Data: https://romo-nps.opendata.arcgis.com/search?q=boundaries
Graduate Degree Winners
No Graduate Degree Applications were Received this Year
Unfortunately, no applications were received for the graduate section of this year’s scholarship, and therefore no awards were granted in this category.
We encourage eligible graduate students to apply next year and take advantage of this opportunity to further their academic and professional goals.


